If you log into your AdSense account every morning, you already know the problem. The default reports show data, but they don’t tell a story. You see yesterday’s revenue, but you can’t spot a trend across last month. You know your RPM, but you cannot compare it with the previous quarter without exporting everything to a spreadsheet and starting over. That is why building a custom Google Sheets AdSense revenue dashboard template changes the game for small publishers and bloggers. It puts all your key numbers in one place, updates automatically, and costs exactly zero dollars.
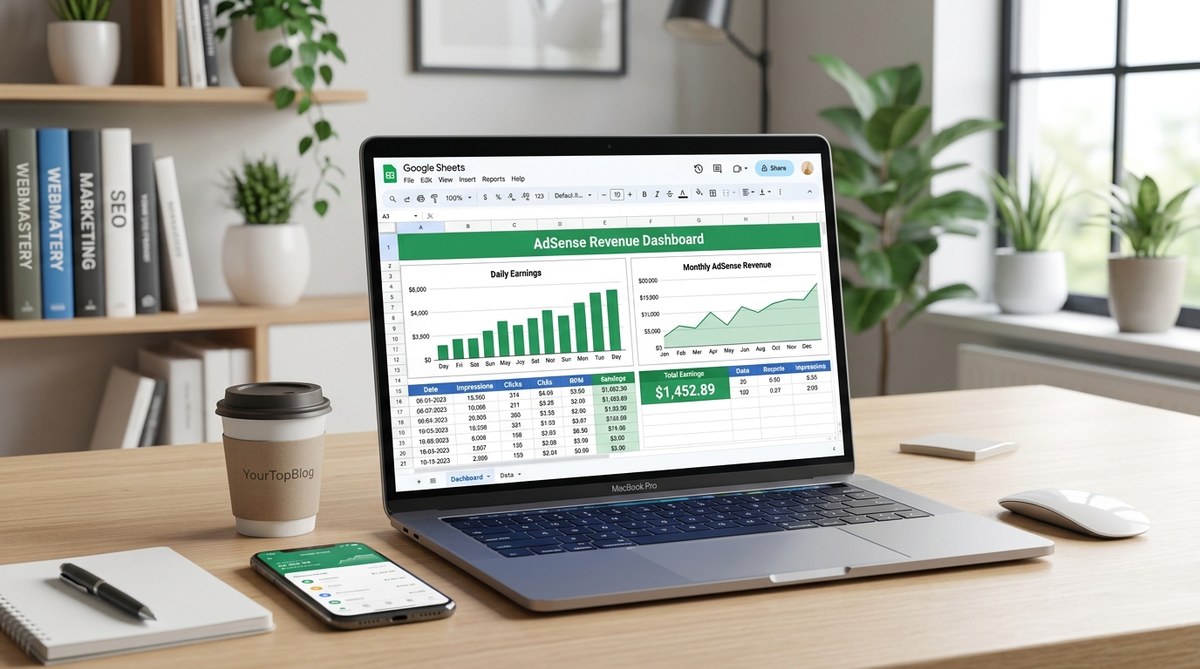
A Google Sheets AdSense revenue dashboard lets you monitor daily earnings, page RPM, and clickthrough rates without paid tools. By connecting AdSense reports to a live spreadsheet, you can track trends, compare weeks, and make data-driven decisions. This tutorial walks you through building your own template from scratch in under an hour.
Why a Custom Dashboard Beats the Default Reports
Google AdSense gives you a lot of numbers. Impressions, clicks, page RPM, estimated earnings. But the default interface is built for a general audience, not for your specific site. You might need to see how your weekends compare to weekdays. Or you might want a monthly running total without adding up columns by hand. A custom dashboard solves all of that.
A few years ago I relied on the AdSense homepage. Every morning I wrote down the day’s earnings in a notebook. That worked until I missed a week and had no way to backfill the gaps. Now I use a Google Sheets dashboard that pulls the same data and shows me a 30 day trend line in seconds. It also helped me catch a drop in RPM that turned out to be a misconfigured ad unit. Without the dashboard I would have lost another week of revenue.
A free template built in Sheets is especially useful for bloggers who do not want to pay for premium analytics tools. When you are just starting out every dollar counts. This method keeps your budget intact while still giving you professional level monitoring.
What You Will Need Before You Start
You do not need advanced spreadsheet skills. Here is the short list of requirements:
- A Google account (free).
- Access to your Google AdSense dashboard.
- Basic familiarity with Google Sheets (adding formulas, making charts).
- About 45 minutes of time.
That is it. No plugins, no paid subscriptions, no coding. We will use a built in Google Sheets function called GoogleFinance? Actually no, we will use the Google Sheets “ImportXML” or “ImportData” functions to pull data from your AdSense download. But there is a cleaner way: you will export a CSV from AdSense and use “ImportData” to bring it into Sheets. Or better yet, you can use the Google AdSense connector if you have a free account with a service like Zapier? No, we want to keep it completely free. The simplest approach is to use the “=IMPORTRANGE” function to pull from a shared template, or manually copy periodic exports. But for a truly live dashboard, we will connect your AdSense account via Google Sheets’ built in “Data” menu using the “Connected Sheets” feature? Actually, that requires a separate license. So the most practical free method: use Google Sheets’ “Google Sheets API” via Apps Script to fetch AdSense data directly.
I recommend using a script that runs daily and appends new data. Do not worry, I will provide the script code that you can copy and paste. If you are not comfortable with scripts, you can still download a CSV from AdSense once a week and import it manually. The dashboard will still work, just with less automation.
Step by Step: Build Your Own Google Sheets AdSense Revenue Dashboard Template
Follow these six steps to create a dashboard that updates automatically. I have broken them down so you can do one at a time.
-
Create a new Google Sheet and set up your main tabs. Start with a blank sheet. Rename the first tab “Dashboard” and create a second tab called “Raw Data”. The Dashboard tab will show charts and summary numbers. The Raw Data tab will store your AdSense export.
-
Write a simple Apps Script to fetch AdSense daily data. Go to Extensions > Apps Script. Paste the provided code (see sample below). Replace the AdSense reporting ID with your own. The script will pull yesterday’s data and add it as a new row in the Raw Data tab. You can trigger it to run daily via a time driven trigger.
-
Create your raw data columns. In the Raw Data tab, add columns: Date, Estimated Earnings, Impressions, Clicks, Page RPM, Click Through Rate. The script will fill these automatically.
-
Build summary formulas on the Dashboard tab. Use SUM, AVERAGE, and MAX functions. For example:
- Total Earnings this month:
=SUMIF(Raw Data!A:A, ">= " & DATE(2026, MONTH(TODAY()), 1), Raw Data!B:B) - Average Page RPM:
=AVERAGE(Raw Data!E:E) -
Best Day Earnings:
=MAX(Raw Data!B:B) -
Add charts. Insert a line chart for daily earnings over the last 30 days. Insert a bar chart comparing RPM by week. Insert a scorecard for total earnings this year. This is where the dashboard becomes visual and useful at a glance.
-
Set up conditional formatting. Highlight the current day’s row in green. Highlight any day where RPM drops below your target threshold in red. This alerts you to problems without staring at raw numbers.
Expert advice: Start with a simple line chart of daily earnings. It gives you immediate insight into whether you are in an up or down trend. Add more charts only after you have used the basic version for a month. Overcomplicating early leads to abandonment.
Here is an example of what your Raw Data might look like after a few days:
| Date | Earnings | Impressions | Clicks | Page RPM | CTR |
|---|---|---|---|---|---|
| 2026-05-01 | 12.50 | 4500 | 35 | 2.78 | 0.78% |
| 2026-05-02 | 14.20 | 4800 | 38 | 2.96 | 0.79% |
| 2026-05-03 | 10.10 | 3900 | 30 | 2.59 | 0.77% |
You can use this table to test your formulas.
Key Metrics Every Blogger Should Track in Their Dashboard
Not all AdSense numbers matter equally. Focus on these five when you design your template.
- Estimated earnings per day: The bottom line. Track this on a line chart to see seasonality.
- Page RPM (Revenue per thousand impressions): This measures how valuable your traffic is. A rising RPM means your ad placements or content are improving.
- Impressions: Tells you how many ad units loaded. A drop may indicate site speed issues or traffic loss.
- Clicks: Combined with impressions gives you CTR.
- Click through rate (CTR): A low CTR could mean ad placement problems. If CTR is below 0.5% you might want to try different ad formats or positions.
You might also add a comparison to the same week last year. But for most small publishers, the five metrics above are enough to start making decisions. Over time you can expand to include metrics like “earnings per 1,000 sessions” if you connect Google Analytics data, but that is an advanced step.
Common Mistakes to Avoid When Setting Up Your Template
I have seen many bloggers build a dashboard and then stop using it within a month. Avoid these pitfalls.
| Mistake | Why It Happens | How to Fix It |
|---|---|---|
| Not automating data entry | Manual exports feel like a chore after a week | Set up the Apps Script with daily trigger. If you cannot script, batch export once a week and import via =IMPORTRANGE from a shared template. |
| Overcomplicating the layout | Too many charts and tables create noise | Start with only three charts: daily earnings, RPM trend, and a summary card. Add more only when needed. |
| Forgetting to check the dashboard weekly | Building it is fun, using it is not | Add a recurring calendar reminder every Monday to spend 5 minutes on your dashboard. |
| Using broken formulas | A misplaced range or date format | Test each formula with sample data. Check that dates are in the same format AdSense exports (often MM/DD/YYYY). |
The biggest mistake is waiting for the perfect template before starting. You can always refine later. The important thing is to put the first version together today.
Take Your Dashboard Further with Additional Data Sources
Once you have the core AdSense dashboard working, you can layer on more data. For example, you could bring in your Google Analytics sessions per day to calculate earnings per visitor. You could also include affiliate revenue from Amazon or ShareASale if you keep a separate sheet for that. This turns your dashboard into a full monetization command center.
If you want to compare AdSense performance across different websites, duplicate the Raw Data tab for each site and use sum formulas with named ranges. Many bloggers run multiple niches and this dashboard lets them see which site performs best without logging into separate accounts.
For a deeper dive into improving your AdSense numbers, check out our guide on 7 AdSense Mistakes That Are Costing You Thousands Every Month. It pairs perfectly with the insights from your dashboard.
Your Free Dashboard Is Ready to Build
The power of a Google Sheets AdSense revenue dashboard template is not in the code or the formulas. It is in the habit of reviewing your data regularly. When you see your numbers every week, you notice small changes before they become big problems. You also spot winning patterns that you can repeat.
Find a quiet hour this weekend. Open a new sheet, paste the script, set up your first chart. By Monday morning you will have a live dashboard that shows your AdSense performance in a way the default reports never could. And it will not cost you a cent. That is the kind of win every blogger deserves.